
In 2017 (data from Wikipedia) humanity emitted about 37 giga-tons of fossil CO2, much of it linked to economic activity. Corona has significantly slowed things down. How big of an impact does that have on the atmosphere?
The answer to this question helps gage the measures necessary to tackle climate change. I am certainly not the right guy for that discussion but towards the end of this contribution, you find a few thoughts.
Since 1958, the Mauna Loa Observatory measures the atmospheric CO2 concentration on a weekly basis and makes the data publicly available. The overall trend is well-known:
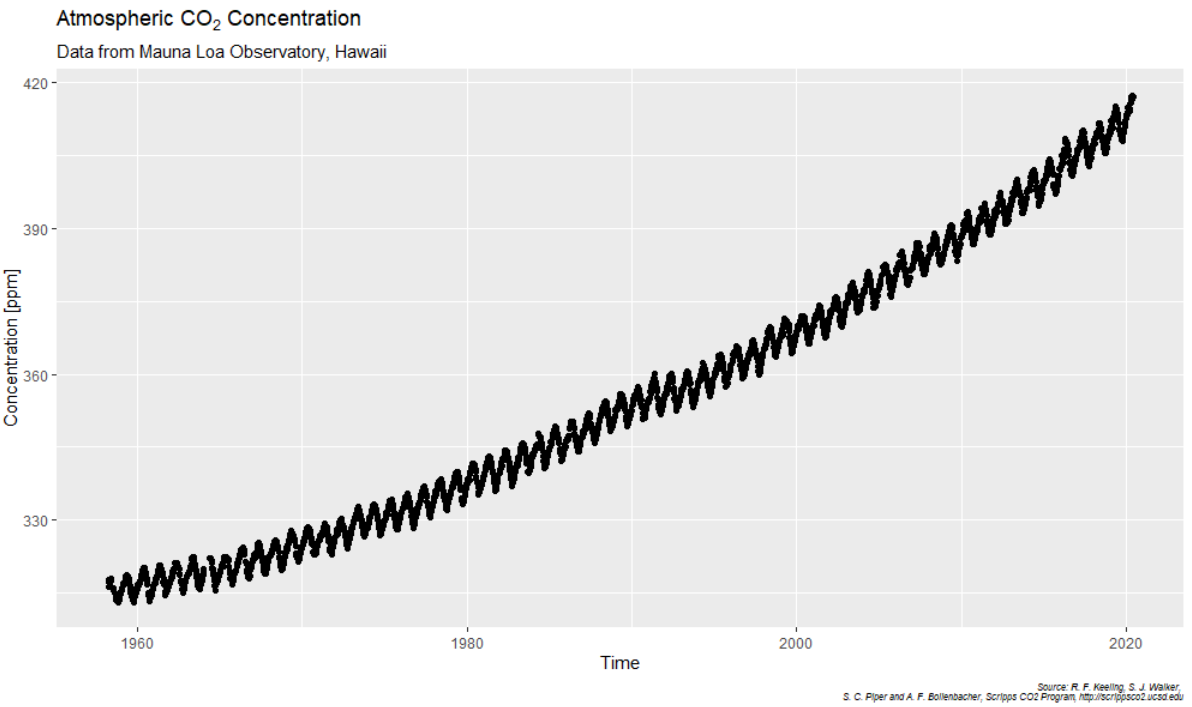
Interestingly, as the plot shows, the CO2-concentration undergoes seasonal oscillations: The Northern land-mass is larger than the Southern which is why, during Siberian spring and summer, CO2 is absorbed from the atmosphere and emitted again during autumn and winter.
The tricky part in our question consists in finding the „Corona-signal“ amongst this variation. The basic idea is to model the above signal for the before-Corona times, predict its further evolution and compare the outcome to what really happened.
We start with a polynomial approximation and find that for times after 1995 a second-order polynom will do. We are then left with modelling the annual cycles:
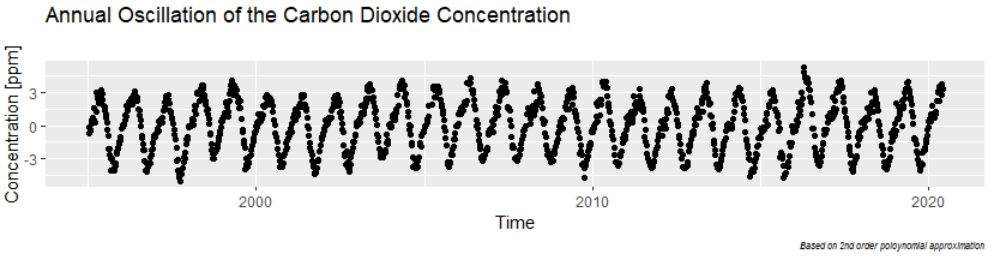
To a climate newby like myself, these cycles are impressive: at a weight of the atmosphere of 5×10¹⁸ kg, a variation of 6ppm summer to winter corresponds to about 100 Gigatons CO2 that planet Earth „breathes in and out“. That is about 3x what humanity emits in fossil CO2 per year.
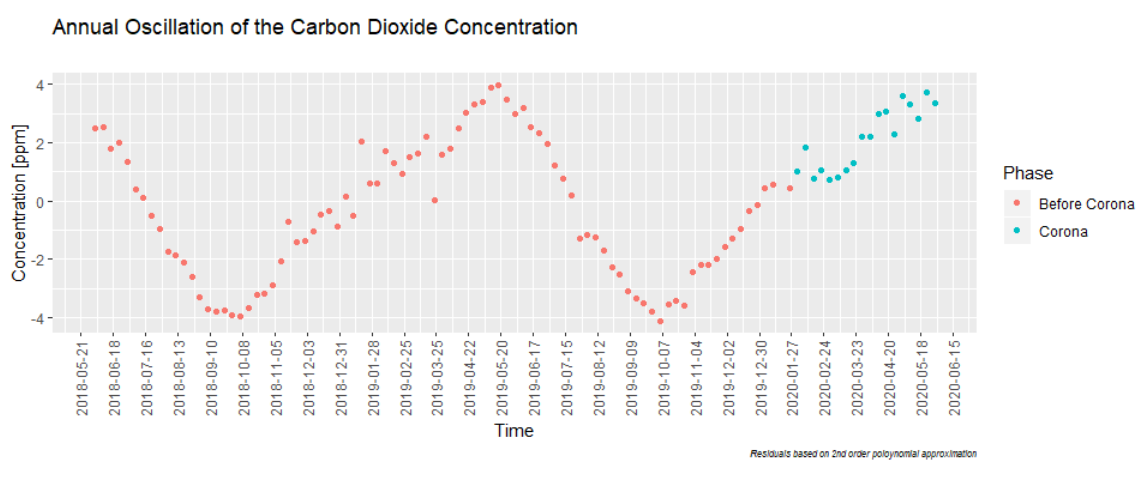
The challenge we are left with is understanding the „Corona-signal“ in these oscillations:
To that purpose, we use the Fast Fourier Transformation (FFT, see betterexplained.com) and get inspiration from Joao Neto’s tutorial on how to do that in R. Here we are not only interested in finding the amplitude of the oscillation but also need the phase-information. Just in case you plan to do that, here are a few tips:
- Interpolate missing values before the analysis
- To reduce artifacts, use time-windows of entire years for the FFT
- Refine your algorithm with a known signal, then approach unknown signals.
What turns out to be hard to model in the annual CO2 cycles is the phase-information. Taking longer periods in time leads to significant phase-shifts on the edges. That is a pity because it is the upper edge we are interested in. Here I use the data between Jan 30 2010, and Jan 30 2020 by when the WHO declared COVID-19 a „public health emergency of international concern“.
In blue we see what happened, in green the model and in red the long-term trend based on a polynomial approximation. For the oscillation, I have used only the two frequencies with the strongest amplitudes. Overall the result looks promising but the devil sits in the details:
With the 2019-cycle we see the overall difficulty to model the phase shift. And yes, many blue dots (what happened) in 2020 are below the green curve (expected behavior without „Corona-effect“). Well,…
…we need to investigate better the residuals (differences between blue and green):
The average of -0.116 ppm is not significantly different from zero („Corona times are no different from what is expected without Corona“), given the overall variation in the residuals. One could argue that it took the world economy some time to settle into „Corona operations“ and that it equally took the planet some time to stirr the atmosphere enough for a lower CO2 concentration to reach remote Hawaii. When we take out of the analysis the two data points from February 1 and 8 (shown in italic), we get an average for the remaining residuals of -0.22 ppm, but this still with a likelihood („P-value“) of 10% that the true average is zero.
In other words:
With our somewhat crude analysis and for a relatively short time of observation, we only find a 90% chance for anything like a „Corona effect“ on the global CO2 concentration.
Most people would wish to be at least 95% certain – and more is definitely better here and elsewhere. We knew things were going to be tricky. For my own business as a consultant, I am still happy to now have algorithms that help me study seasonality in my clients‘ demand data, for example. But that is not the point here.
For climate it pretty much looks like if we were in for a longer race: as the cartoonist from The Economist observed: Corona is only the preliminary round for the world to learn to fight together. After this „warm-up“, climate change then is the real thing. Taking quick shots at CO2 , even as big as a world-wide Corona shut-down, has limited impact.
With that said: the Mauna Loa data earn more thorough investigation than done here – and as quoted above, there are people doing just that. If you have an idea how to better model the data, and to tackle the phase-shift problem better than I do, maybe we can reduce the residuals between model and reality (measured when „learning“ the model with the data from before Corona). In my analysis, they stand at a standard deviation of 0.6 ppm. Lower residuals („noise“) will allow detecting smaller signals…
Ping me, if you have an idea.